That’s how fast the carbon clock is ticking
The MCC carbon clock demonstrates just how much carbon can be released into the atmosphere if global warming is to be capped at 1.5°C, or 2°C.
In the Paris Agreement, all countries worldwide decided to limit global warming to well below 2°C (ideally as much as 1.5°C) compared to pre-industrial levels. This is extremely ambitious and essentially means that we are tightening our carbon budget. In concrete terms, it means that reaching the 2°C target with a high probability would allow us to emit at maximum only about 980 gigatons of CO2 between 2016 and 2100 into the atmosphere.¹ However, at present the world is still emitting 40 gigatons of CO2 every year.⁴ This corresponds to 1268 tons per second. In that context, the remaining budget is shrinking rapidly.
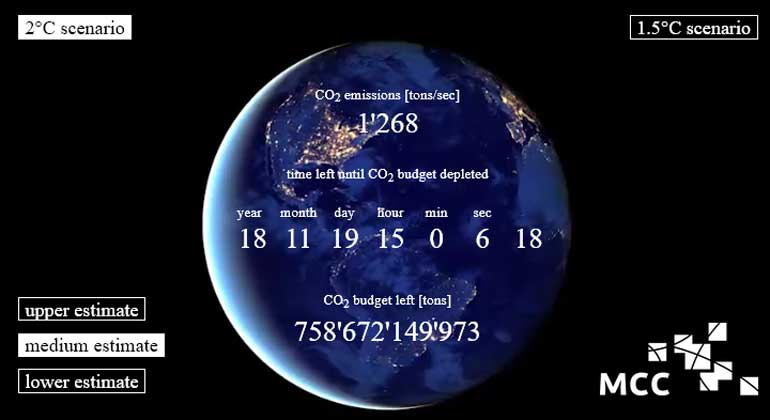
The clock is ticking | By selecting a choice of temperature targets and estimates, you can see how much time remains in each scenario.
The carbon clock of the Mercator Research Institute on Global Commons and Climate Change (MCC) shows just how little time is left for political decision-makers. Visitors of the MCC website can set out to explore which policy objectives under which scientific assumptions would allow for how much time to implement effective action.
For example, on the top left of the clock you can select, for reaching the 2°C target, an optimistic upper estimate (about 940 Gt¹ remain in the budget), a medium estimate (about 760 Gt² remain), or a pessimistic lower scenario (about 390 Gt¹ remain). The right of the screen shows the scenarios that would correspond to the 1.5°C target.³ The carbon budget that corresponds to your selection is then displayed, alongside the remaining time left.
The calculation is based on the assumption that annual emissions remain at the level of 2014⁴; while between 2000 and 2010, an annual growth of greenhouse gas emissions of 2.2% has been observed¹. The MCC scientists Alexander Radebach and Tom Schulze are responsible for the concrete calculations based on the above-mentioned budgets and output rates as well as for the realization of the carbon clock.
……………………………………………………………………………………………………..
¹ IPCC, Climate Change 2014: Mitigation of Climate Change. Contribution of Working Group III to the Fifth Assessment Report of the Intergovernmental Panel on Climate Change. Cambridge, United Kingdom and New York, NY, USA (Cambridge University Press, 2014); SPM Table 1.
² IPCC, 2014: Climate Change 2014: Synthesis Report. Contribution of Working Groups I, II and III to the Fifth Assessment Report of the Intergovernmental Panel on Climate Change [Core Writing Team, R.K. Pachauri and L.A. Meyer (eds.)]. IPCC, Geneva, Switzerland; Table 2.2.
³ J. Rogelj et al., Energy system transformations for limiting end-of-century warming to below 1.5 [deg]C. Nature Clim. Change 5, 519 (2015). // The “medium estimate” for the 1.5°C target is the arithmetic mean of the upper and lower estimates from Rogelj et al.
⁴ C. Le Quéré et al., Global Carbon Budget 2015. Earth Syst. Sci. Data 7, 349 (2015).
Source
Mercator Research Institute on Global Commons and Climate Change (MCC) 2017