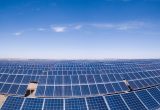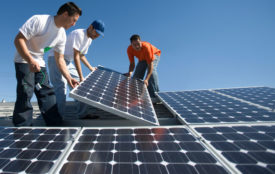
Global power industry tenders in Q3 2019: Solar technology down 26%
Solar technology tenders activity in Q3 2019 saw 314 tenders announced, marking a drop of 26% over the last four-quarter average of 427, according to GlobalData’s power industry tenders database.
Looking at global power tenders activity divided by the type of technology, solar held the second position in terms of number of tenders during Q3 2019 with a 38% share.
The proportion of tenders by category in the Solar technology tracked by GlobalData in the quarter was as follows:
- Project Implementation: 251 tenders and a 79.9% share
- Supply & Erection: 20 tenders and a 6.4% share
- Power Purchase Agreement: 14 tenders and a 4.5% share
- Consulting & Similar Services: 13 tenders and a 4.1% share
- Repair, Maintenance, Upgrade & Others: ten tenders and a 3.2% share
- Electricity Supply: six tenders and a 1.9% share.
Asia-Pacific leads solar tenders activity in Q3 2019
Comparing tenders activity in solar technology in different regions of the globe, Asia-Pacific held the top position with 243 tenders and a share of 77.4% during Q3 2019, followed by Middle East and Africa with 27 tenders and an 8.6% share and North America with 20 tenders and a 6.4% share.
In fourth place was Europe with 18 tenders and a 5.7% share and in fifth place was South and Central America with six tenders and a 1.9% share.
Solar technology tenders in Q3 2019: Top companies by capacity
The top issuers of tenders in Solar technology for the quarter in terms of power capacity involved were:
- Solar Energy Corporation of India (India): 3,072.52MW from five tenders
- NHPC (India) and Emirates Water and Electricity (United Arab Emirates): 2,000MW from one tender
- Maharashtra State Electricity Distribution (India): 1,880MW capacity from 30 tenders.