European State of the Climate 2019: a year of weather in the context of climate change
When it comes to designing strategies to deal with climate variability and change, we are only as powerful as the information at hand. By providing freely accessible, quality-assured climate data, the Copernicus Climate Change Service (C3S) empowers governments, businesses and scientists across Europe and beyond to manage climate risk.
Implemented by the European Centre for Medium-Range Weather Forecasts (ECMWF) on behalf of the European Commission, C3S publishes the European State of the Climate, an annual overview of climate trends and weather events, analysed in the context of historical patterns, for a broad range of climate indicators. The report supports the European Commission’s Green Deal and climate action by providing an essential overview of the past year’s climate, contributing to the longer-term perspective, and providing a benchmark for future assessments of the environment.
With the main data collection for 2019 complete, C3S has just published the latest edition, packed with findings related to temperature, precipitation, sea ice, glaciers, vegetation cover, greenhouse gas concentrations and more.
Mapping the complexities of a changing climate
Earth observation data are of fundamental importance to our understanding of the state of our planet, but a complex mosaic of indicators is required to produce a meaningful picture of the climate, its variability and its long-term changes. The European State of the Climate draws on data and expertise from across the C3S community, other Copernicus services and external partners, examining how climate variables have fluctuated over the year and presenting select indicators that monitor long-term trends.
The Director of C3S, Carlo Buontempo, explains why the service is well placed to meet the challenges of compiling data from such a wide range of contributors.
“As part of the Copernicus family of services, C3S strives to produce useful climate information from raw data, rendering it accessible to a broad audience of expert and non-expert users from policymakers to business leaders and scientists. C3S is in a unique position of having the infrastructure and international expertise to create the European State of the Climate, which offers valuable insights relevant for so many sectors of society.”
Revealing the data behind the information
The European State of the Climate aims to show readers the pathway between the information in the report and the data and analyses behind it, making the connection as transparent as possible. For each edition, the C3S team looks for ways to improve how they achieve this. The 2019 report seeks to make the content more accessible for non-expert readers by adding in more detail on the types of data used. The report builds on measurements from satellites and ‘in-situ’ stations located on land, in the air or at sea, fed into state-of-the-art computer models to recreate historical climate conditions at any given time in the past 40 years anywhere on the planet.
Buontempo adds: “This reconstruction of past weather helps determine how unusual a particular weather event is, and by extension, whether it fits with climate change trends or is more the result of natural climate variability.”
Each section in the 2019 report contains an indication of the type of data used and the reference period in order to give readers valuable context. Such an approach is also required to overcome limitations in datasets. For many of the indicators used in the report, datasets of 40 years are available. For others, such as indicators of vegetation and land cover, data stretch back less than 30 years.
2019 in data
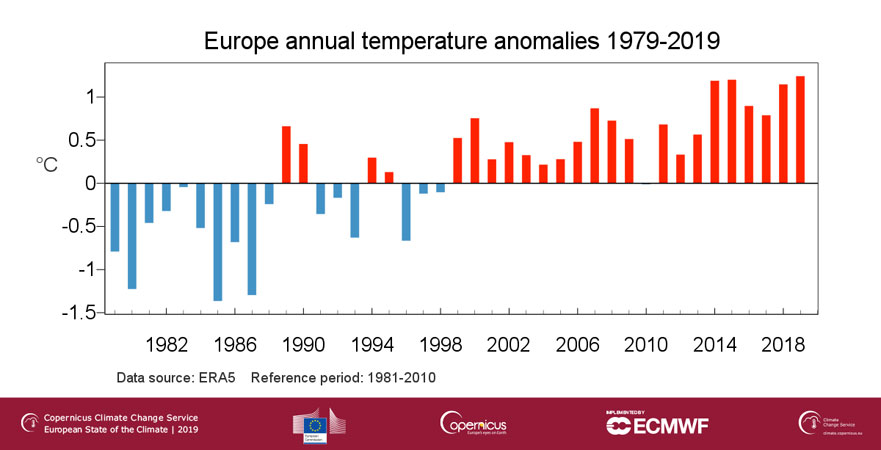
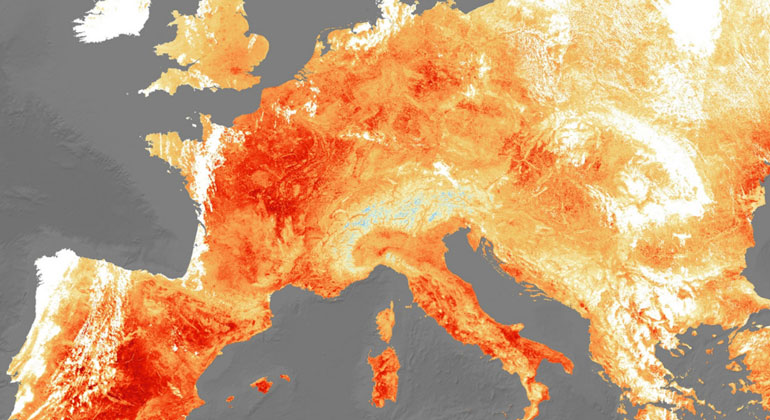
So how does 2019 fit in with longer term climate trends? The newest edition of the European State of the Climate reveals it was the hottest year on record for Europe, closely followed by 2014, 2015 and 2018. Three distinct periods of temperatures much above those expected for the time of year were recorded for large parts of the continent, one warm spell in late February, and two heatwaves during June and July. Rainfall was close to average for the year as a whole, but late autumn saw higher than average precipitation in western and southern Europe, with episodes of extreme precipitation, leading to high river discharge and in flooding in many regions.
Further information on the climate report:
- https://climate.copernicus.eu/ESOTC/2019
- https://climate.copernicus.eu/ESOTC/2019/european-temperature
- https://www.sueddeutsche.de/wissen/klimawandel-hitzewellen-temperaturrekorde-europa-1.4884434