
“Energy-Charts” Data Platform Launches Price Simulator
What would happen to the price of electricity if significantly more battery storage systems were traded on the market?
The Fraunhofer Institute for Solar Energy Systems ISE is releasing a price simulator today on its Energy-Charts.info platform that answers this question using real market data. The tool uses the actual buy and sell bids from the daily electricity exchange auction and adds a freely selectable number of battery storage units. For each quarter-hour, users can see how the exchange electricity price would have changed, how the batteries charge and discharge, and what their charge levels are. The freely accessible simulator is updated daily with the latest electricity trading results.
“There’s a lot of discussion about the impact of battery storage on electricity prices, mostly based on models for the future. Our simulator uses actual bids submitted each day. Anyone can use it to see what effect more storage on the market would have had,” explains Leonhard Gandhi, project manager for the Energy Charts at Fraunhofer ISE.
At the heart of the simulator is an interactive chart for each week: It shows the actual day-ahead price for Germany alongside the simulated price with the selected battery fleet, as well as the power at which the batteries charge and discharge, their charge level, the potential feed-in from solar and wind energy, and electricity consumption (load). Three settings can be freely combined: battery capacity (0 to 20 gigawatts), storage duration (two to six hours), and market scenario. For the latter, you can simulate whether power plants with their block bids lasting several hours react to changing prices and whether neighboring countries are taken into account via electricity market coupling. All results are then available at a quarter-hour resolution and can be downloaded as data. Like all Energy Charts graphics, the page is available in five languages.
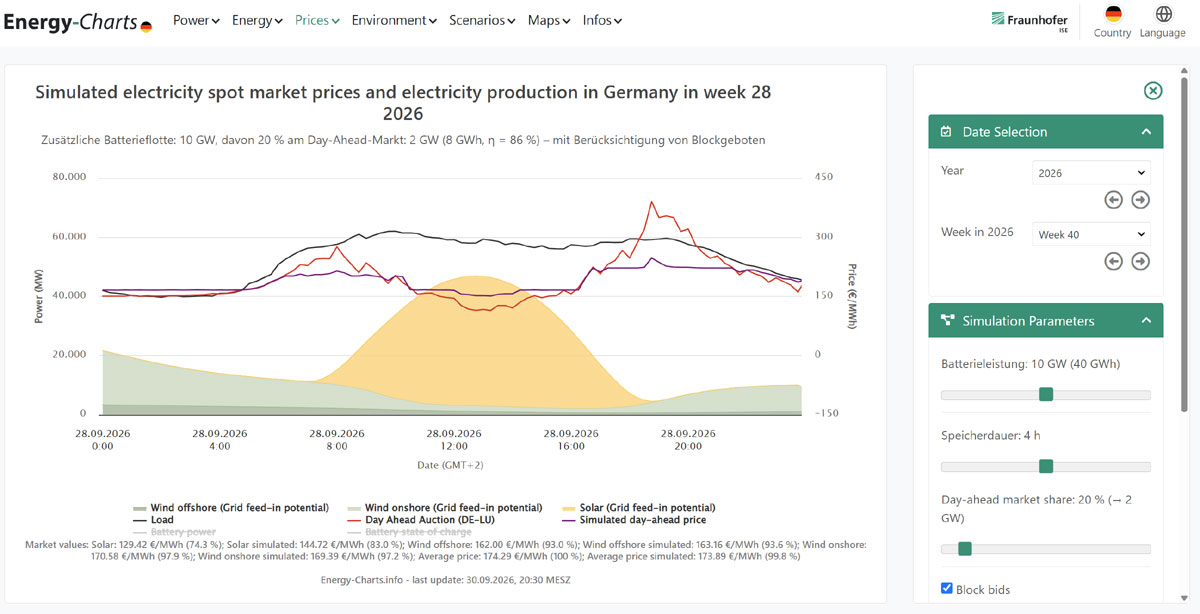
The simulator’s data is based on the buy and sell curves from the day-ahead auction, as aggregated by the European power exchange EPEX SPOT. These curves reflect the market’s entire bidding behavior for a given day. The simulator adds the bids from the battery fleet: It buys electricity when it is cheap and sells it when it is expensive, in a way that maximizes its profit over the course of an entire week. Every purchase and sale shifts the curves and thus the price that all other market participants receive. In the simulation, the batteries operate at an efficiency of 86 percent, and their aging costs per megawatt-hour (MWh) stored are included.
The reaction of power plants and inflexible consumers is particularly complex to simulate: Many buy or sell their electricity in blocks lasting several hours. If the battery fleet changes prices, such blocks may drop out of the market or re-enter it. The simulator explicitly calculates the auction using these block bids. A second market scenario includes neighboring countries, which react to price changes in Germany via electricity market coupling. The computational effort is considerable: For each week, two thousand combinations of power output, storage duration, and scenario are calculated.
Analysis for the Year 2025
An analysis of the 2025 results in the scenario with block bids and without cross-border electricity trade shows the effect of battery storage: If 20 GW of batteries with a 2-hour storage duration (equivalent to 40 gigawatt-hours of capacity) are deployed, the average price difference across all days between the most expensive and the cheapest quarter-hour of a day drops from 130 to 53 euros per MWh (-60 percent). The number of hours with prices above 200 euros per MWh drops from 169 to 20, while the number of hours with negative prices falls from 575 to 271. The market value of solar power rises by 35 percent, from 45.08 euros per MWh to 61.02 euros per MWh.
Two days in 2025 clearly illustrate the potential of battery storage: On January 20, 2025—the most expensive day of the year—20 GW of batteries would have lowered the evening price peak from 583 to 221 euros per MWh. On May 11, by contrast—the day with the lowest price—the storage systems would have absorbed the midday electricity and raised the price from -250 to -20 euros.
Data Foundation for the Battery Debate
The expansion of battery storage in Germany is accelerating, and with it, the debate over its benefits for the power system. The simulator is designed to ground this debate in a common data set: policymakers, grid operators, project developers, the media, and the public can see how storage systems cap price spikes, reduce negative prices, and increase the market value of solar power—while also highlighting the limits of their effectiveness. Because data has been available every week since January 1, 2025, it is also possible to analyze specific events, such as periods of low sunlight and low wind, holidays with negative prices, or days with record-high prices. The simulator is a “what-if” analysis based on real data, not a forecast. It shows the impact on the day-ahead market; revenues and benefits from storage in intraday trading, system services, and balancing energy—as well as the relief it provides to the grids—are additional factors and are not included. No computational model based on current bids can fully simulate how power plants and neighboring countries would adapt to a permanently larger storage fleet.
“Storage systems smooth out prices, but they don’t generate electricity. The simulator illustrates both of these points very clearly and thus also shows that we need to consider storage and reliable power generation together,” said Leonhard Gandhi.
The development of the electricity price simulator was financially supported by ECO STOR GmbH, the German Association for New Energy Economy (bne), Harmony Energy GmbH, Return J&P GmbH, BELECTRIC GmbH, MaxSolar GmbH, FENECON GmbH, Kyon Energy Solutions GmbH, and Remmers Solar GmbH.