UMD Analysis of Satellite Data Shows Felling of Tropical Trees has Soared, Not Slowed
The rate at which tropical forests were cut, burned or otherwise lost from the 1990s through the 2000s accelerated by 62 percent, according to a new study which dramatically reverses a previous estimate of a 25 percent slowdown over the same period.
That previous estimate, from the U.N.’s Food and Agriculture Organization’s (FAO) Forest Resource Assessment, was based on a collection of reports from dozens of countries. The new estimate, in contrast, is based on University of Maryland analysis of vast amounts of Landsat image data which directly record the changes to forests over 20 years.
“Several satellite-based local and regional studies have been made for changing rates of deforestation [during] the 1990s and 2000s, but our study is the first pan-tropical scale analysis,” explains University of Maryland geographer Do-Hyung Kim, lead author of the new study which was accepted for publication on February 9 in Geophysical Research Letters (GRL), a journal of the American Geophysical Union.
Kim and his University of Maryland colleagues Joseph Sexton and John Townshend looked at 34 forested countries which comprise 80 percent of forested tropical lands. They analyzed 5,444 Landsat scenes from 1990, 2000, 2005 and 2005 with a hectare-scale (100 by 100-meter) resolution to determine how much forest was lost and gained. Their procedure was fully automated and computerized both to make the huge datasets manageable and to minimize human error.
They found that during the 1990-2000 period, the annual net forest loss across all the countries was 4 million hectares (15,000 square miles) per year. During the 2000-2010 period, the net forest loss rose to 6.5 million hectares (25,000 square miles) per year – a 62 percent increase is the rate of deforestation. That last rate is the equivalent to clear cutting an area the size of West Virginia or Sri Lanka each year, or deforesting an area the size of Norway every five years.
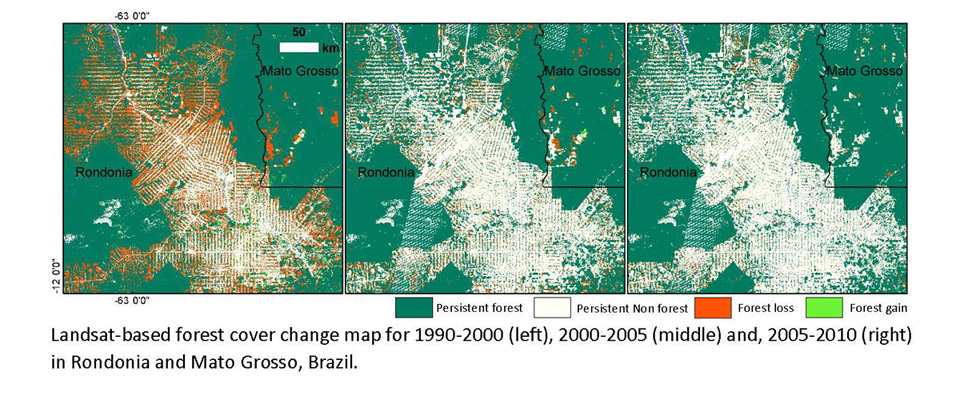
In terms of where the deforestation was happening, they found that tropical Latin America showed the largest increase of annual net loss of 1.4 million hectares (5,400 square miles) per year from the 1990s to the 2000s, with Brazil topping the list at 0.6 million hectares (2,300 square miles) per year. Tropical Asia showed the second largest increase at 0.8 million hectares (3,100 square miles) per year, with similar trends across the countries of Indonesia, Malaysia, Cambodia, Thailand and the Philippines. Tropical Africa showed the least amount of annual net forest area loss. Still, there was a steady increase of net forest loss in tropical Africa due to cutting primarily in Democratic Republic of Congo and Madagascar.
The new, satellite-based study “really provides a benchmark of tropical forest clearing not provided by other means,” said geographer Douglas Morton, who studies forest cover by satellite sensing at NASA’s Goddard Space Flight Center in Greenbelt, Maryland, and is not a coauthor on the GRL paper.
Morton notes that the new, satellite-based estimates are particularly important for those trying to understand the global amounts of carbon being released into the air (primarily in the forms of the climate-warming gases carbon dioxide and methane) or being taken up by plants, soils and waters.
“Tropical deforestation plays a big role in global climate cycles,” he explained, pointing out that the cutting and burning of forests accounted for 20 percent of greenhouse gas emissions in 1990s.
“It’s not really a surprise that the new research shows dramatically higher deforestation rates although without the transparency of Landsat satellite data is difficult to put your finger on changing trends,” Morton added.
“Tropical deforestation has become increasingly more mechanized,” he observed, “In the 60s, it was axes; in the 70s, chainsaws; and in the 2000s, it was tractors.” For him, he explained, an increase in deforestation rates makes technological sense.
Global forest change data used in this study are freely available via the Global Land Cover Facility.