Antarctica’s Delicate Face
When climate change causes Antarctica’s glaciers to flow out to sea faster, it’s not good news: when this happens, the frozen giants lose more and more ice, which, when it melts, raises the sea level. But how quickly this takes place, and at what scale, doesn’t just depend on rising temperatures; the bed below the ice also plays a critical role.
After all, while some types of terrain can slow ice loss, others can accelerate it. Until recently, however, not enough was known about the topography below the ice to gauge these risks. A new map, which experts from the Alfred Wegener Institute, Helmholtz Centre for Polar and Marine Research (AWI), contributed to, sheds new light on the subject.
Hidden hills and valleys, or even kilometre-deep troughs that no-one ever knew existed? Maps with massive blank areas that still haven’t been filled in? This all sounds like tales from the days of the early explorers. Yet, even in the satellite age, there are still mysterious landscapes to investigate. For example, until now, researchers have had only a very vague idea of what the bed below the Antarctic ice, which can be up to a kilometre thick, actually looks like.
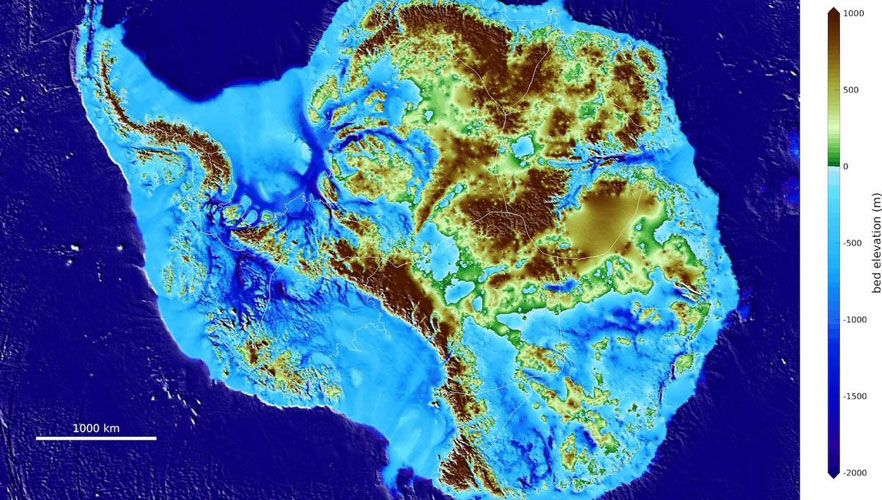
But now an international research team led by Mathieu Morlighem from the University of California in Irvine has provided a more accurate portrait of this hidden landscape. In the journal Nature Geoscience, the experts recently presented the most accurate topographical map of the coast of Antarctica ever made. And researchers from the AWI contributed essential data to the project, dubbed ‘BedMachine Antarctica’.
Granted, this isn’t the first map of the surface beneath the ice. The most recent one was released in 2013 and was based solely on radar readings. “These are usually taken by flying over the respective area in an aeroplane,” says ice specialist Prof Olaf Eisen from the AWI. The radar system mounted on the plane fire their signals downward, where they penetrate the ice and are reflected back by the ground below it. This makes it possible to determine at which depth the ice and rock meet. “However, that really only tells us how the hills and depressions directly below the ice surveyed are distributed,” Eisen explains. As for what the terrain between these points looks like, the researchers who created the previous map used a simple technique to interpolate it.
Yet these projected values could easily be off by a few hundred metres of elevation. Consequently, the BedMachine team not only integrated a wealth of new measurement data concerning the ice thickness in several regions into their analyses; above all, their goal was to more precisely model the face of the landscape between the surveyed areas.
“To do so, a computer model was used that was fed with satellite data on the ice’s flow speed,” says Eisen. Drawing on principles from ice physics, the experts could then deduce how the bed must be shaped in order for the frozen masses to actually move as observed at the respective position. “For example, if you determine that three cubic kilometres of ice flow into a valley, but only two cubic kilometres flow out the other end, then the projected terrain form for the valley’s mouth can’t be right,” the AWI expert explains. When this happens, he and his colleagues know one thing: the valley in question must be much deeper than previously assumed.
Admittedly, the new analyses haven’t rewritten the book on the large-scale topography of Antarctica. When it comes to the detailed topography, however, the researchers have gained a wealth of new insights – including their most spectacular discovery, below Denman Glacier in East Antarctica. There, an ice-filled trough extends 3.5 kilometres below sea level, which is a new world record: no deeper point on land has ever been discovered.
Other landforms that the team discovered or at least gained new insights into may not look as impressive, but can also have far-reaching consequences. The hills and depressions under the ice can determine whether a glacier remains comparatively stable despite rising temperatures, or rapidly disappears due to climate change.
Things look especially grim for a glacier when its underside lies below sea level and the terrain slopes inland; then ice masses can quickly become unstable when the ocean warms. In this regard, the processes at what is known as the grounding line are critical. For glaciers that discharge into the ocean, this is the point at which the ice no longer rests on solid ground and instead begins floating on the water.
If now, thanks to climate change, warm seawater begins melting the glacier from underneath, the grounding line begins shifting further inland. If the terrain also slopes downward in this direction, it has a thick sheet of ice covering it. But the thicker the ice, the faster it flows out to sea. “As a result, the ice retreats farther and farther, and a self-amplifying process is set in motion,” explains Prof Angelika Humbert, a fellow ice researcher at the AWI. For some time now, experts have feared that this effect could cause many of the glaciers in West Antarctica that flow into the Amundsen Sea to collapse.
“Thanks to the new map, we can now more accurately predict in which regions the glaciers are especially vulnerable to climate change,” says Olaf Eisen. For example, they now know that, on West Antarctica’s Thwaites Glacier and Pine Island Glacier, the terrain slopes farther and deeper inland than previously assumed. For these glaciers, which ice experts already considered to be ‘problem children’, the future now looks even bleaker. But such areas with problematic topographies can also be found in East Antarctica, e.g. the massive Recovery Glacier, which drains 40 percent of East Antarctica. And the record-breaking troughs below Denman Glacier could also contribute to its destabilisation.
That being said, the insights offered by the new map aren’t all bad news. For example, previously undiscovered ridges could help to stabilise the ice flowing over the Transantarctic Mountains. As a result, these ice masses may be able to withstand climate change longer than previously projected. “These new findings will help us to better assess the stability of glaciers in various regions,” Eisen concludes. “Only then can we realistically estimate whether, and if so, by how much they could cause the sea level to rise.”
- Mathieu Morlighem et al.: Deep glacial troughs and stabilizing ridges unveiled beneath the margins of the Antarctic ice sheet. Nature Geoscience, 2019, DOI: 10.1038/s41561-019-0510-8
Source
Alfred Wegener Institute, Helmholtz Centre for Polar and Marine Research (AWI) 2020