Climate signals detected in global weather
Searched for and found: climate researchers can now detect the fingerprint of global warming in daily weather observations at the global scale. They are thus amending a long-established paradigm: weather is not climate – but climate change can now be detected in daily weather.
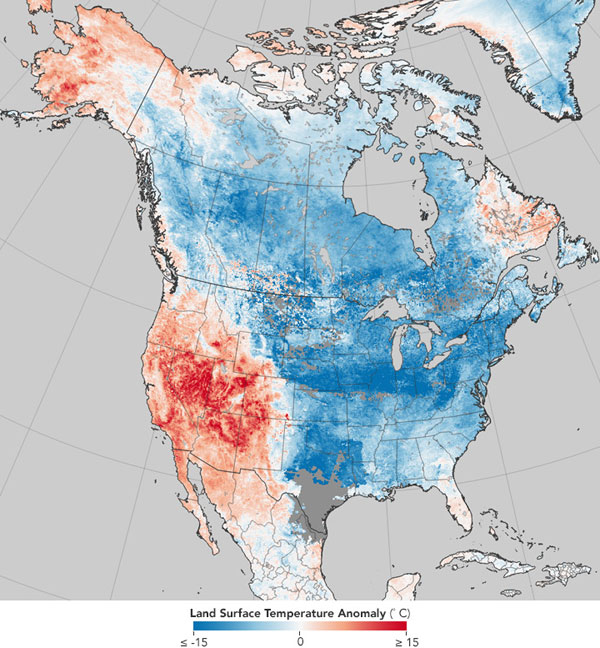
In October this year, weather researchers in Utah measured the lowest temperature ever recorded in the month of October in the US (excluding Alaska): -37.1°C. The previous low-temperature record for October was -35°C, and people wondered what had happened to climate change.
Until now, climate researchers have responded that climate is not the same thing as weather. Climate is what we expect in the long term, whereas weather is what we get in the short term – and since local weather conditions are highly variable, it can be very cold in one location for a short time despite long-term global warming. In short, the variability of local weather masks long-term trends in global climate.
A paradigm shift
Now, however, a group led by ETH professor Reto Knutti has conducted a new analysis of temperature measurements and models. The scientists concluded that the weather-is-not-climate paradigm is no longer applicable in that form. According to the researchers, the climate signal – that is, the long-term warming trend – can actually be discerned in daily weather data, such as surface air temperature and humidity, provided that global spatial patterns are taken into account.
In plain English, this means that – despite global warming – there may well be a record low temperature in October in the US. If it is simultaneously warmer than average in other regions, however, this deviation is almost completely eliminated. “Uncovering the climate change signal in daily weather conditions calls for a global perspective, not a regional one,” says Sebastian Sippel, a postdoc working in Knutti’s research group and lead author of a study recently published in Nature Climate Change.
Extracting the fingerprint of climate change
In order to detect the climate signal in daily weather records, Sippel and his colleagues used statistical learning techniques to combine simulations with climate models and data from measuring stations. Statistical learning techniques can extract a “fingerprint” of climate change from the combination of temperatures of various regions and the ratio of expected warming and variability. By systematically evaluating the model simulations, they can identify the climate fingerprint in the global measurement data on any single day since spring 2012.
A comparison of the variability of local and global daily mean temperatures shows why the global perspective is important. Whereas locally measured daily mean temperatures can fluctuate widely (even after the seasonal cycle is removed), global daily mean values show a very narrow range.
If the distribution of global daily mean values from 1951 to 1980 are then compared with those from 2009 to 2018, the two distributions (bell curves) barely overlap. The climate signal is thus prominent in the global values but obscured in the local values, since the distribution of daily mean values overlaps quite considerably in the two periods.
Application to the hydrological cycle
The findings could have broad implications for climate science. “Weather at the global level carries important information about climate,” says Knutti. “This information could, for example, be used for further studies that quantify changes in the probability of extreme weather events, such as regional cold spells. These studies are based on model calculations, and our approach could then provide a global context of the climate change fingerprint in observations made during regional cold spells of this kind. This gives rise to new opportunities for the communication of regional weather events against the backdrop of global warming.”
The study stems from a collaboration between ETH researchers and the Swiss Data Science Center (SDSC), which ETH Zurich operates jointly with its sister university EPFL. “The current study underlines how useful data science methods are in clarifying environmental questions, and the SDSC is of great use in this,” says Knutti.
Data science methods not only allow researchers to demonstrate the strength of the human “fingerprint”, they also show where in the world climate change is particularly clear and recognisable at an early stage. This is very important in the hydrological cycle, where there are very large natural fluctuations from day to day and year to year. “In future, we should therefore be able to pick out human-induced patterns and trends in other more complex measurement parameters, such as precipitation, that are hard to detect using traditional statistics,” says the ETH professor.
- Sippel S, Meinshausen N, Fischer EM, Székely E, Knutti R: Climate change now detectable from any single day of weather at global scale. Nature Climate Change 2019, January 2nd, DOI: 10.1038/s41558-019-0666-7


