Green Economies around the World?
Iron, gold, sand, coal, oil, wood, rice – and many more belong to the natural resources, which build the base of the economic well-being of modern consumer societies.
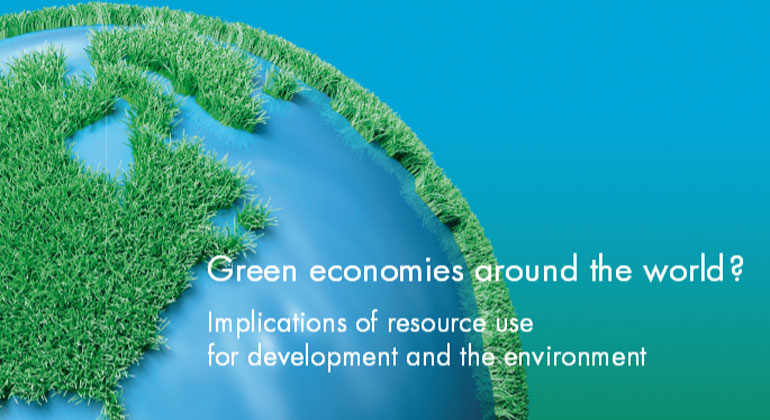
Sustainability concepts use the “ecological rucksack” for measuring the use of these resources as an additional indicator besides the water rucksack, the CO2-emissions and the land use. The “ecological rucksack” is the main actor in this story – a global story about resource use, economic growth and its decoupling.
But let’s start from the beginning. Did you know that in the consumer society of today the average European needs three up to five times as many resources as his ancestors, which lived on agriculture and cattle breeding? This means that his shopping trolley is filled with an ecological rucksack which is three up to five times as heavy as the one of his ancestor. This doesn’t seem surprising, considering that our way of life has changed dramatically. Nevertheless the big question is: Where do all these resources come from? With this question we reach the present again – a time with large inequalities and increasingly scarce natural resources.
In the last thirty years consumption, trade and the total amount of extracted resources have steadily increased – in some regions stronger, in others less. The world region with the highest material consumption needs 11 times as much as the region with the lowest material consumption. This means 11 times as much metals, sand and gravel for the construction of infrastructure, 11 times as much oil and coal for energy production – this being independent of the population size. The per capita consumption of resources shows a different picture. In some countries it has strongly increased, in some it has stagnated and in some it has decreased. A new study by SERI in cooperation with the German geographer Monika Dittrich gives surprising insights in the global trends of resource extraction and consumption, focusing on the period between 1980 and 2008.
Especially since the year 2000, the material consumption has been increasing strongly, primarily caused by the growth dynamic of China. In contrast to 1980, today China’s consumption per capita is similar to the European consumption. This example shows that differences between certain world regions decrease stronger than expected. But this trend can be misleading – it doesn’t mean that the average Chinese enjoys the same standard of living as the average European.
It rather shows the high investments of China in infrastructure like buildings, power stations, streets and airports. With more than 1.3 billion people, China is the world’s most populous country and uses so many resources for infrastructure development that the per capita consumption keeps the same level as the European per capita consumption. The absolute values are even highe: China is the worldwide largest consumer of natural resources – far ahead of Europe and the USA. What does that mean for a world with increasingly scarce natural resources threatened by climate change?
The report – a world atlas of global resource use – reveals these connections with its detailed analysis and serves as basis for further discussion.
The report can be downloaded here
Source
SERI Nachhaltigkeitsforschungs und –kommunikations GmbH 2012


