U.S. Solar Market Adds 10.6 GW of PV in 2017, Community Solar Soars
In 2017, the U.S. solar market expanded, adding double-digit gigawatt solar photovoltaic (PV) additions for the second year in a row.
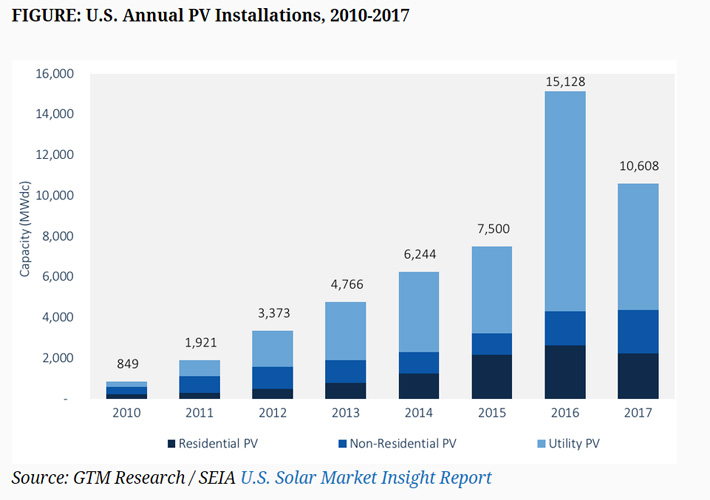
According to the newly released U.S. Solar Market Insight Report 2017 Year-in-Review from GTM Research and the Solar Energy Industries Association (SEIA), the solar industry installed 10.6 gigawatts (GW) of new PV capacity in 2017, led by strong growth in the corporate and community solar segments.
While overall growth was down from the 15 GW installed in the record-shattering 2016, last year’s capacity addition still represents 40 percent growth over 2015’s installation total.
“The solar industry delivered impressively last year despite a trade case and market adjustments,” said SEIA President and CEO Abigail Ross Hopper. “Especially encouraging is the increasing geographic diversity in states deploying solar, from the Southeast to the Midwest, that led to a double digit increase in total capacity.”
The non-residential market segment got its moment in the spotlight in 2017, growing 28 percent year-over-year, notching its fourth straight year of annual growth. Last year in particular saw an “explosion” in the community solar market, led by Minnesota and Massachusetts.
“Minnesota headlined a banner year for community solar, with more megawatts installed in that state than total U.S. community solar installations in all of 2016,” said Austin Perea, GTM Research solar analyst and co-author of the report. “We expect community solar to diversify geographically in 2018, with Maryland and New York to be key growth markets for the sub-segment beginning this year.”
However, the residential and utility-scale segments saw installations fall on an annual basis for the first time since GTM Research and SEIA began publishing the report in 2010.
The year-over-year downturn for the utility segment in 2017 was largely expected, due to the massive influx of installations seen in 2016 as projects were rushed to completion before the anticipated expiration of the 30 percent federal Investment Tax Credit. The report notes that uncertainty surrounding the Section 201 tariffs caused many projects to be postponed or canceled, while interconnection delays and PURPA cancellation resulted in many projects spilling over into 2018.
Of the top 10 state markets for residential solar in 2016, only two saw annual growth in 2017. However, 25 of the 44 states tracked in the report saw year-over-year growth in annual residential PV installations with several states climbing up in the rankings.
Florida managed to break into the top 10 states for the first time since 2011, jumping to the No. 10 spot for cumulative solar capacity installed. Over the last year, South Carolina also saw big gains, moving up 9 spots in the new rankings to No. 18 in the U.S.
California and North Carolina remain the two largest solar states after adding the most and second-most capacity in 2017, respectively.
Because of the federal and state policy changes and market dynamics, GTM Research lowered its base-case forecast for 2018-2022 by 13 percent. Still, total installed U.S. PV capacity is expected to more than double over the next five years, and by 2023, more than 15 GW of PV capacity will be installed annually.
Key findings from the report include:
- In 2017, the U.S. market installed 10.6 GWdc of solar PV, a 30% decrease year-over-year from 2016.
- In 2017, 30% of all new electric generating capacity brought online in the U.S. came from solar, ranking second during that period only to natural gas.
- Q4 2017 saw price increases in most PV market segments stemming from increases in module costs. This was due to a global shortage of Tier 1 module supply and the uncertainty spurred by the Section 201 petition. However, the price increases were mitigated by falling prices in racking and inverters, improving operating efficiencies, and likely margin compression.
- The residential PV sector fell 16% from 2016. This contraction was driven by weakness in California and major Northeast markets, which continue to feel the impact of pullback from certain national installers that have shifted away from rapid-expansion strategies.
- In contrast to residential PV, the non-residential sector grew 28% year-over-year, primarily driven by regulatory demand pull-in from looming policy deadlines in California and the Northeast, in addition to the continued build-out of a robust community solar pipeline in Minnesota.
- Voluntary procurement, rather than state-mandated Renewable Portfolio Standards, will continue to be the primary driver of new utility PV demand, anticipated to drive 1/3 of utility build-out in 2018.
- GTM Research forecasts another 10.6 GWdc of new PV installations in 2018.
- In response to the impact of Section 201 and corporate tax reform, GTM Research has reduced its total U.S. solar PV forecasts by 13% from 2018E-2022E since the last edition of this report.
- Total installed U.S. PV capacity is expected to more than double over the next five years, and by 2023, over 15 GW of PV capacity will be installed annually.
Graphic: GTM Research / SEIA U.S. Solar Market Insight Report