EWI tool update: China has a cost advantage in green hydrogen
Compared with Germany, the USA and Japan, China would have the best supply-side preconditions for a green hydrogen-intensive economy. This is shown by a case study using the updated EWI Global PtX Cost Tool 2026, which is available for download.
China currently has the best supply-side preconditions for a green hydrogen-intensive economy, compared to Germany, Japan, and the U.S. This is because China has abundant and cost-effective domestic production potential, with costs averaging 120 USD/MWh. Germany could meet its future demand through a combination of domestic production and imports of green hydrogen at an average cost of 175 USD/MWh. The U.S. could meet its demand domestically, though at a higher cost than China and Germany. In a direct comparison, Japan would have the worst conditions in terms of both costs and dependence on imports. Green hydrogen could become an important economic factor in the course of the energy transition, both as an energy source and for material use in the industry. In the long term, this growing importance would make the costs and security of supply of this green hydrogen source a key location factor.
These are the findings of “Supply-side preconditions for a green hydrogen economy: A case study with the EWI Global PtX Cost Tool 2026”, a case study by the Institute of Energy Economics at the University of Cologne (EWI) published together with the updated tool. The case study compares the supply costs and potentials of green hydrogen in China, Germany, Japan and the USA and derives the supply-side preconditions for a green hydrogen-intensive economy from them. The analysis was funded by the “Förderinitiative Wasserstoff und Moleküle” of the Gesellschaft zur Förderung des Energiewirtschaftlichen Instituts an der Universität zu Köln e.V.
China and the USA would have sufficient domestic potential
China and the USA are expected to be able to produce their future hydrogen demand domestically and would therefore not depend on imports. China could produce at around 120 USD/MWh on average, giving it a cost advantage over the USA, whose production costs of around 225 USD/MWh on average would be almost twice as high. “The cost advantage is due to good sites for wind and solar energy, low investment costs for renewable energy plants and electrolyzers, and lower labor and financing costs,” says Dr.-Ing. Ann-Kathrin Klaas, who conducted the analysis and the tool update together with Jonas Günzl, Michael Moritz and David Wohlleben.
Germany, by contrast, has limited domestic potential. Imports from North Africa and other EU countries make import costs of around 175 USD/MWh possible, which would be cheaper than in the USA. However, this low-cost import potential is scarce, and in a global market other countries could also seek to access it. “Import dependency could put Germany at a disadvantage compared with China and the USA in terms of security of supply and price levels,” says Klaas. Japan has only small and expensive domestic production potential. As an island nation without pipeline links to the mainland, Japan could only import hydrogen by ship. Ship imports can entail a shipping premium of 80 USD/MWh or more. Despite this premium, domestic production would not be competitive with ship imports from China, which could cost around 190 USD/MWh on average. However, Japan’s current hydrogen strategy does not name China as a potential supplier. Without imports from China, import costs would rise to more than 300 USD/MWh.
Tool update introduces new analyses and improves the methodology
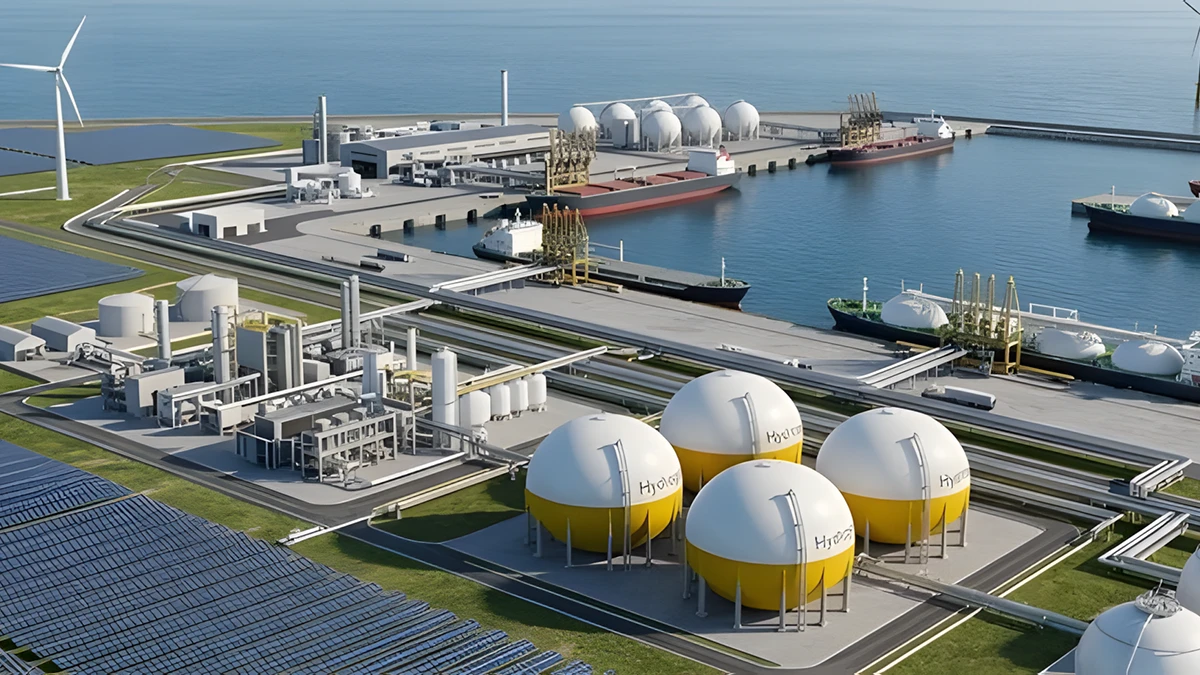
The EWI Global PtX Cost Tool models the technically feasible global supply of green hydrogen and its derivatives ammonia, methane, methanol and Fischer-Tropsch fuels, including the costs of production and transport by pipeline or ship. For the 2026 update, EWI has updated key assumptions, such as the investment costs for renewable energy plants and electrolyzers and the country-specific weighted average cost of capital (WACC). In addition, the tool now works with a higher geographical resolution, splitting large countries into multiple model regions, and a revised classification of PV potential. New analyses include cost-potential curves and the seasonality factor, a measure of how strongly production fluctuates over the course of the year. The tool is available free of charge on the EWI website. For their own calculations, users can compare two cost scenarios up to 2050 (baseline and optimistic) and two supply profiles (baseload and volatile).
Source
Institute of Energy Economics at the University of Cologne (EWI) 2026