How is the EU doing in terms of environment, transport and energy?
Eurostat publication – A statistical portrait of key EU policy areas
How much energy is produced within the European Union (EU) and how much is imported from third countries? In which Member States are electricity and gas the cheapest? How does the energy mix in my country compared with other Member States? What is the share of renewables in energy consumption and how efficient is the consumption of energy in the EU? What is the share of diesel passenger cars in the EU and what is the modal split of both passenger and freight transport? Does my country have fewer road accidents? How is the EU progressing in reducing its greenhouse gas emissions? Is my country well ranked in terms of resource productivity? How many tonnes of waste are generated and recycled every year per inhabitant? And what about the development of biodiversity over recent years?
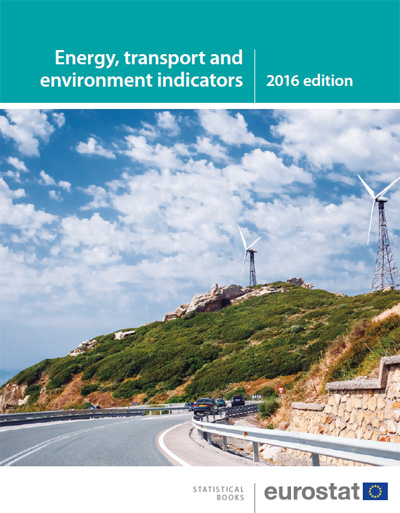
The answers to these questions and many more are found in the 2016 edition of the Energy, transport and environment indicators statistical book, published today by Eurostat, the statistical office of the European Union. The objective of this publication is to provide an overview of the most relevant indicators on energy, transport and environment. It presents data for the European Union, for the EU Member States as well as for the candidate countries and EFTA countries.
- total energy consumption in the EU in 2014 fell below its early 1990s level
- household electricity prices in the EU have risen by about a third since 2008, while household gas prices have increased by about a quarter
- oil and petroleum products have remained during the last 25 years by far the most important contributor to overall energy supply.
- 4 million road tractors and semi-trailers are registered within the EU, equivalent to half the length of motorways in the EU (80 000 km)
- 80 million containers (TEU) were handled in EU ports in 2014, equivalent to about 60% of the distance to the moon
- there are in the EU half as many passenger cars (250 million) as inhabitants.
Finally, the Environment chapter includes indicators on climate change and greenhouse gas emissions, waste generation and treatment, water resources, abstraction and use, wastewater treatment, forestry and biodiversity, chemicals, material flow accounts and economic indicators on environmental protection expenditure, the environmental goods and services sector and environmental taxes. Did you know for instance that:
- over nearly the entire period 2000-2013, the environmental economy grew faster in the EU than the overall economy, generating in 2013 output worth €700 billion and securing 4.2 million full-time equivalent jobs
- economic growth is dematerializing, with EU’s resource productivity (i.e. the GDP generated out of one kilogram of raw material) increasing by 30% over the last decade
- 475 kg of municipal waste were generated per capita in 2014 of which 44% were recycled or composted.
Energy, transport andenvironment indicators | 2016 edition | pdf-download (EN)
