New App “PowerSignal” Displays Renewable Share in Europe’s Electricity Mix
Many people want to use the greenest electricity mix available to charge their electric cars, run their heat pumps or smart home appliances.
With the infor-mation on the new “PowerSignal” app from the Fraunhofer Institute for Solar Energy Systems ISE, this is now possible. The app, which shows the current share of renewables in the net public electricity generation for 12 European countries and the day-ahead electricity price for 34 European countries, is now available for Android devices. With this app, the users can adjust their electricity consumption with the renewable share accordingly.
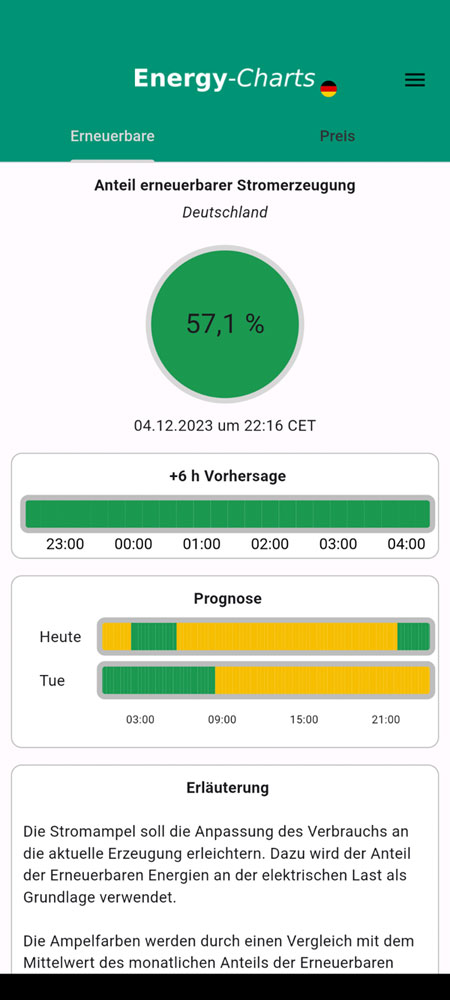
The share of renewable energies in net public electricity generation is steadily increasing, averaging 57.2 % in the first of 2023 in Germany, for example, and 55.9% in the load. “Renewable resources, and thus a green electricity supply, are weather-dependent. In order to minimize the need for electricity storage in a renewable-based energy system, it makes sense to adapt electricity consumption to the supply,” explains Prof. Bruno Burger, Senior Scientist at Fraunhofer ISE. His team has therefore developed the “PowerSignal” app, which displays the current share of renewable energy in the load. The new app is available in the popular app stores for Android (from Android 8) and as a direct download on the platform “Energy Charts”. The research team is already working on an iOS version (from iOS 16.2). The app is currently available in German, English, French, Spanish and Italian.
The app uses a traffic light to which varies its color based on the relationship between the current renewable share and the average over the last five years for the respective month (e.g., 48% for June). If the current share is ten percent below this average, the traffic light is red; if it is ten percent above, it is green. For the values in between, the light is yellow. New electricity data is available every fifteen minutes. The data are usually updated hourly to show the current forecast. Next-day forecasts are generally available on the previous evening from 7 p.m. on.
More detailed data is, of course, available. For example, the contribution of the individual renewable sources to the load currently and as a forecast can be shown. In addition, the day-ahead price on the electricity exchange for any of the 34 European countries listed can also be used as the basis for the electricity traffic light.
Openly accessible data for all interested parties
The Fraunhofer ISE team makes the current energy data available to all interested parties through the “Energy Charts” website, in the app and via an open interface (API).
The information on the app allows users to start their smart home devices accordingly when the traffic light changes to green. Other energy flow processes in the energy system, such as electric vehicle charging at a charging station or power-consuming events like big-data processing can also be controlled in this way. An electric vehicle drives an average of 300 kilometers a week, and the charging process can often be postponed.
“Unlike other apps, our power signal app does not offer a financial incentive. It is primarily intended to maximize the renewable electricity consumption and bring more transparency to electricity consumption,” explains Leonhard Probst from the Energy Charts team. By using electricity at times when there is a high supply of renewable electricity, consumers can actively participate in the energy transition themselves.
European market leader BSH uses app for device control
BSH Hausgeräte GmbH, which owns brands such as Bosch, Siemens, Gaggenau and Neff, is already using the energy data in its control algorithms. With the “Home Connect” app of the leading European appliance manufacturer, users can control their smart kitchen und household appliances. They also can automatically start programs according to the renewable share in the electricity supply, for example, when large amounts of renewable energy are being fed into the grid.
