2014 on course to be one of hottest, possibly hottest, on record Exceptional heat and flooding in many parts of the world
The year 2014 is on track to be one of the hottest, if not the hottest, on record, according to preliminary estimates by the World Meteorological Organization (WMO).
This is largely due to record high global sea surface temperatures, which will very likely remain above normal until the end of the year. High sea temperatures, together with other factors, contributed to exceptionally heavy rainfall and floods in many countries and extreme drought in others.
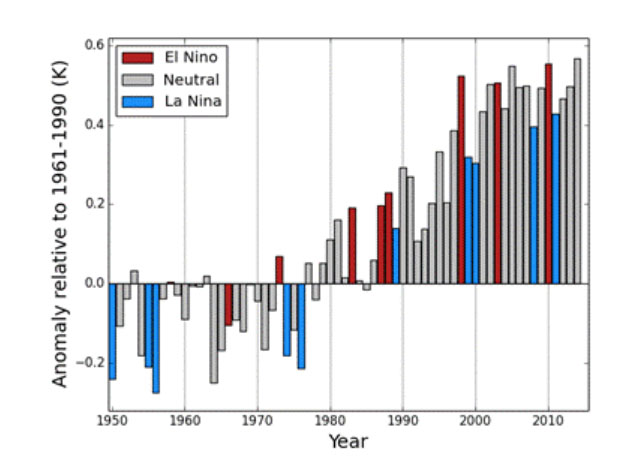
WMO’s provisional statement on the Status of the Global Climate in 2014 indicated that the global average air temperature over land and sea surface for January to October was about 0.57° Centigrade (1.03 Fahrenheit) above the average of 14.00°C (57.2 °F) for the 1961-1990 reference period, and 0.09°C (0.16 °F) above the average for the past ten years (2004-2013).
If November and December maintain the same tendency, then 2014 will likely be the hottest on record, ahead of 2010, 2005 and 1998. This confirms the underlying long-term warming trend. It is important to note that differences in the rankings of the warmest years are a matter of only a few hundredths of a degree, and that different data sets show slightly different rankings.
The high January to October temperatures occurred in the absence of a full El Niño-Southern Oscillation (ENSO). ENSO occurs when warmer than average sea-surface temperatures in the eastern tropical Pacific combine, in a self-reinforcing loop, with atmospheric pressure systems, thus affecting weather patterns globally. During the year, sea surface temperatures increased nearly to El Niño thresholds but this was not coupled with an atmospheric response. However, many weather and climate patterns normally associated with El Niño/Southern Oscillation (ENSO) were observed in many parts of the world.
“The provisional information for 2014 means that fourteen of the fifteen warmest years on record have all occurred in the 21st century,” said WMO Secretary-General Michel Jarraud. “There is no standstill in global warming,” he said.
“What we saw in 2014 is consistent with what we expect from a changing climate. Record-breaking heat combined with torrential rainfall and floods destroyed livelihoods and ruined lives. What is particularly unusual and alarming this year are the high temperatures of vast areas of the ocean surface, including in the northern hemisphere,” he said.
“Record-high greenhouse gas emissions and associated atmospheric concentrations are committing the planet to a much more uncertain and inhospitable future. WMO and its Members will continue to improve forecasts and services to help people cope with more frequent and damaging extreme weather and climate conditions,” said Mr Jarraud.
The provisional statement was published to inform the annual climate change negotiations taking place in Lima, Peru. WMO also updated its acclaimed Weather Reports for the Future series, with scenarios for the weather in 2050 based on the Fifth Assessment report from the Intergovernmental Panel for Climate Change, which is co-sponsored by WMO and the UNEP. Newly added reports are for Peru, France, Viet Nam, Spain, Canada and Norway, painting a compelling picture of what life could be like on a warmer planet.
Christiana Figueres, Executive Secretary UN Framework Convention on Climate Change (UNFCCC), said: “Our climate is changing and every year the risks of extreme weather events and impacts on humanity rise.”
“Fortunately our political climate is changing too with evidence that governments, supported by investors, business and cities are moving towards a meaningful, universal climate agreement in Paris 2015 — an agreement that keeps a global temperature rise below 2 degrees C by putting in place the pathways to a deep de-carbonisation of the world’s economy and climate neutrality or ‘net zero’ in the second half of the century,” said Ms. Figueres.
Highlights from the Statement
Land surface temperatures
Average surface air temperatures over land for January to October 2014 were about 0.86°C above the 1961-1990 average, the fourth or fifth warmest for the same period on record.
Western North America, Europe, eastern Eurasia, much of Africa, large areas of South America and southern and western Australia were especially warm. Cooler-than-average conditions for the year-to-date were recorded across large areas of the United States and Canada and parts of central Russia.
Heatwaves occurred in South Africa, Australia and Argentina in January. Australia saw another prolonged warm spell in May. Record heat affected northern Argentina, Paraguay, Bolivia and southern Brazil in October. Notable cold waves were reported in the U.S. during the winter, Australia in August and in Russia in October.
Ocean heat
Global sea-surface temperatures were the highest on record, at about 0.45°C above the 1961-1990 average.
Sea surface temperatures in the eastern tropical Pacific approached El Niño thresholds. They were also unusually high in the western tropical Pacific Ocean, across the north and north-east Pacific as well as the polar and subtropical North Atlantic, southwest Pacific, parts of the South Atlantic and in much of the Indian Ocean. Temperatures were particularly high in the Northern Hemisphere from June to October for reasons which are subject to intense scientific investigation.
Ocean heat content for January to June was estimated down to depths of 700m and 2000m and both were the highest recorded.
Around 93% of the excess energy trapped in the atmosphere by greenhouse gases from fossil fuels and other human activities ends up in the oceans. Therefore, the heat content of the oceans is key to understanding the climate system.
Sea level and sea ice
As the oceans warm, their volume increases through thermal expansion. Water from the melting of ice sheets and glaciers also contributes to sea level rise. Local variations in sea level are affected by currents, tides, storms and large-scale climate patterns like El Niño. In early 2014, global-average measured sea-level reached a record high for the time of year.
Arctic sea-ice extent reached its annual minimum extent of 5.02 million km2 on 17 September and was the sixth lowest on record, according to the National Snow and Ice Data Center.
Antarctic daily sea ice reached a maximum daily extent of 20.11 million km2 on 22 September, setting a new record for the third consecutive year. The changes in the atmospheric circulation observed in the past three decades, which resulted in changes in the prevailing winds around Antarctica, are considered by scientists as factors related to this increase. However, it is possible that this increase is due to a combination of factors that also include effects of changing ocean circulation.
Flooding
Twelve major Atlantic storms affected the United Kingdom through the winter 2013/14 and the UK winter was the wettest on record, with 177% of the long-term average precipitation. In May, devastating floods in Serbia, Bosnia-Herzegovina and Croatia affected more than two million people. In Russia, in late May and early June, more than twice the monthly average precipitation fell in Altai, Khakassia and Tuva republics in southern Siberia. In September, southern parts of the Balkan Peninsula received over 250% of the monthly average rainfall and, in parts of Turkey, over 500% of normal. July and August were very wet in France with the two-month total being the highest on record (records begin 1959). Between 16 and 20 September, parts of southern France recorded more than 400mm of rainfall – three to four times the normal monthly average. Heavy rain in central and southern Morocco in November caused severe flooding. At Guelmim, 126mm of rain fell in four days, the monthly average for November is 17mm and the average for the year is 120mm.
The monthly precipitation over the Pacific side of western Japan for August 2014 was 301% of normal, which was the highest since area-averaged statistics began in 1946. In August and September, heavy rains caused severe flooding in northern Bangladesh, northern Pakistan and India, affecting millions of people.
Buenos Aires and northeastern provinces of Argentina were severely affected by flooding. In February, many stations in northern and central Argentina reported record rainfall totals for the month. In May and June, precipitation totals in excess of 250% of the long term average were recorded in Paraguay, southern Bolivia and parts of south east Brazil. The heavy rain led to flooding on the Parana River which particularly affected Paraguay, where more than 200,000 people were affected.
On 29 and 30 April, torrential rain fell across the Southeast, Mid-Atlantic and Northeast of United States causing significant flash flooding. At one location in Florida, the two-day precipitation total was a record 519.9 mm.
Drought
Precipitation in the southern part of Northeast China and parts of the Yellow River basin and Huaihe River basin did not reach half of the summer average, causing severe drought.
Parts of Central America suffered rainfall deficits in the summer. Parts of eastern and some areas of central Brazil are in a state of severe drought with severe water deficits extending back more than two years. São Paulo city has been particularly affected with a severe shortage of stored water.
As of mid-November 2014, large areas of the western U.S. remained in drought with areas of California, Nevada and Texas having received less than 40% of the 1961-1990 average. Canada experienced dry conditions at the start of 2014 with many regions only receiving 50-70% of the baseline average in the west and north between January and April.
At the start of the year, northeast New South Wales and southeast Queensland in Australia had long-term rainfall deficiencies.
Tropical cyclones
Until 13 November, 72 tropical storms – storms where wind speeds equalled or exceeded 17.5 m/s (63 km/hr) were recorded, fewer than the 1981-2010 average of 89 storms.
In the North Atlantic basin there were only eight named storms. The Eastern North Pacific basin saw above average hurricane activity, with 20 named storms.
In the Western North Pacific basin, twenty named tropical cyclones formed between 18 January and 20 November, slightly below the 1981-2010 average of twenty-four storms (to the end of November). Ten of the cyclones reached typhoon intensity. Typhoons Nakri and Halong, contributed to the high precipitation totals recorded in western Japan in August. Typhoon Rammasun displaced more than half a million people in the Philippines and China in July.
The North Indian Ocean basin recorded three storms, slightly below the 1981-2010 average of four storms. Two of these storms – Hud Hud and Nilofar – became very severe cyclonic storms.
Australia experienced a slightly-below-average number of tropical storms in 2014, with four cyclones making landfall.
In the South West Indian Ocean basin, a total of eight named tropical storms formed during the period from 1st January to April. For the full season, which started in 2013, nine storms formed, equal to the long-term average. In the South West Pacific basin, six storms formed in addition to four in the Australian region; the combined total of 10 storms is slightly below the long-term average of 12 storms.
Greenhouse gases
The latest analysis of observations by the WMO Global Atmosphere Watch Programme shows that atmospheric levels of carbon dioxide (CO2), methane (CH4), and nitrous oxide (N2O) reached new highs in 2013. Data for 2014 have not yet been processed.
Globally-averaged atmospheric levels of CO2 reached 396.0 parts per million (ppm), approximately 142% of the pre-industrial average. The increase from 2012 to 2013 was 2.9 ppm which is the largest year to year increase, with a number of stations in the Northern hemisphere recording levels above 400 ppm. The overall increase in atmospheric CO2 from 2003 to 2013 corresponds to around 45% of the CO2 emitted by human activities. The remaining 55% is absorbed by the oceans and the terrestrial biosphere.
CH4 concentrations in the atmosphere reached a new high of 1824 parts per billion (ppb) in 2013. That is approximately 253% of the pre-industrial level. Global concentrations of N2O reached 325.9 ± 0.1 ppb, 121% of the pre-industrial level.
NOAA’s Annual Greenhouse Gas Index shows that from 1990 to 2013, radiative forcing by long-lived greenhouse gases increased by 34%. CO2 alone accounted for 80% of the increase.
WMO Analysis Methods
The WMO global temperature analysis is principally based on three complementary datasets maintained by the Hadley Centre of the UK’s Met Office and the Climatic Research Unit, University of East Anglia, United Kingdom (combined); the U.S. National Oceanic and Atmospheric Administration (NOAA) National Climatic Data Centre; and the Goddard Institute of Space Studies (GISS) operated by the National Aeronautics and Space Administration (NASA). Global average temperatures are also estimated using reanalysis systems, which use a weather forecasting system to combine many sources of data to provide a more complete picture of global temperatures. WMO uses data from the reanalysis produced by the European Centre for Medium-Range Weather Forecasts.
Notes to Editors
The provisional statement is being released at the 20th Conference of the Parties to the United Nations Framework Convention on Climate Change, taking place in Lima, Peru. Final updates and figures for 2014 will be published in March 2015.