This Interactive Chart Explains World’s Top 10 Emitters, and How They’ve Changed
A lot has happened since countries met in Paris in 2015 and agreed on an accord to combat climate change. So far, more than 140 countries have ratified or otherwise joined the Paris Agreement, representing more than 80 percent of global emissions. Several major economies, including Canada, Germany and Mexico, have also developed long-term plans to decarbonize their economies.
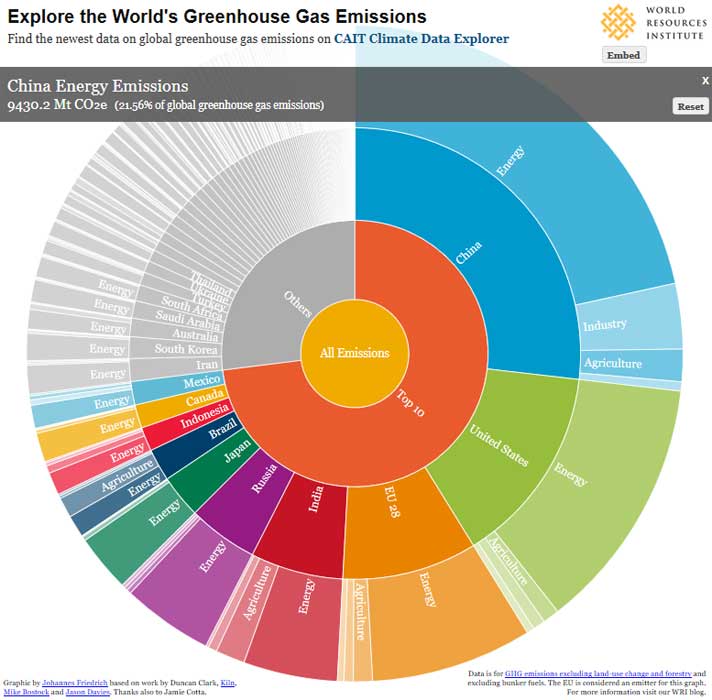
As countries implement their targets and policies and develop more detailed pathways to reduce their emissions, it’s important to fully understand our global emissions picture and how it has changed over time. WRI recently updated its CAIT Climate Data Explorer on the world’s top greenhouse gas-emitting countries with the latest global data available (2013). Here’s an interactive chart to explore it by country and by economic sector, showing how the top emitters have changed in recent years.
1) The World’s Top 3 Emitters Contribute 14 Times the Emissions of the Bottom 100
The top three greenhouse gas emitters— China, the European Union and the United States—contribute more than half of total global emissions, while the bottom 100 countries only account for 3.5 percent.1 Collectively, the top 10 emitters account for nearly three-quarters of global emissions. The world can’t successfully tackle the climate change challenge without significant action from these countries.
2) The Energy Sector Is the Major Culprit, but Action in Every Sector Counts
Over the past 10 years, the energy sector has remained the largest contributor to emissions over any other sector, representing 72 percent of global emissions in 2013.
China saw the largest increase in single-sector emissions from 2012 to 2013 from its energy production, which increased by 365 million metric tons of carbon dioxide equivalent (MtCO2e), or 4 percent. The majority of these emissions came from an increase in electricity production, heating and transportation. However, this does represent a lower rate of increase than the historical average —China’s average annual growth rate for coal consumption from 2000 to 2013 was 8.8 percent.
On the other hand, Australia, the world’s 15th -largest emitter, saw the largest emissions decrease in a single sector, with its agricultural emissions dropping by 65 MtCO2e, or a reduction of 34.6 percent since 2012. The majority of those reductions came from a decrease in the area of burning savannah2, which reduced methane (CH4) and nitrous oxide (N2O) emissions.
3) Some Major Emitters are Reversing their Trends
From 2012 to 2013, the top 10 emitters cumulatively increased their emissions by 2.2 percent, compared to the average annual growth of 2.4 percent over the last 10 years. Within that same period, the top two global emitters, China and the United States, saw the largest single year percentage increase in greenhouse gas emissions, with a rise of 4.3 and 1.4 percent respectively.
Even with that growth of emissions from 2012-2013 by top emitters, if we expand the timescale, their combined emissions have remained the same for the past decade.3 In that time, the United States peaked its emissions in 2007, and the European Union, the third-largest emitter, saw steady reductions. Others have stabilized their emissions over the last 10 years, including Russia and Canada.
More recent data looking only at energy-related carbon dioxide emissions shows that this type of emission stayed flat globally between 2014 and 2016, even as the global economy grew during the same period. Since carbon dioxide is the most abundant greenhouse gas, this is an encouraging trend. We await further data to see whether other types of greenhouse gases are growing or shrinking, and whether this trend will continue.
As 21 countries are already proving, decoupling carbon dioxide emissions from economic growth is happening. But to avoid the worst impacts of climate change, we need to bend the emissions curve significantly downward.
Explore CAIT Data
Learn more about global emissions by visiting WRI’s CAIT Climate Data Explorer. You can sift through data covering 186 countries, multiple economic sectors, several types of emissions and a 162-year timespan. We also provide tools to explore other dimensions of climate policy, including countries’ Paris Agreement mitigation contributions, projections of emissions from major emitters through 2100, and various dimensions of climate equity.
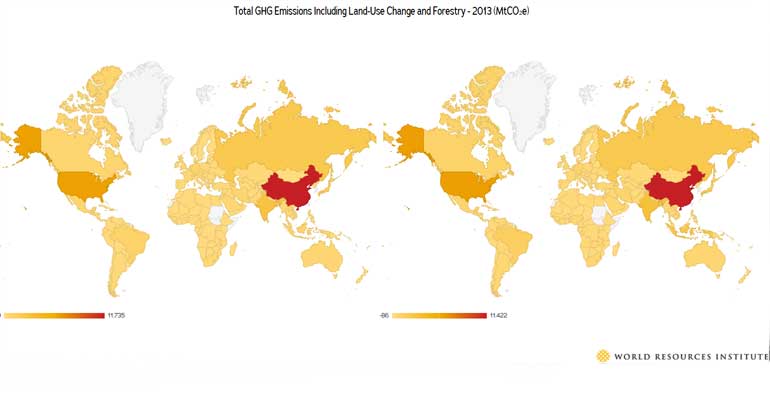
- The interaktive Worldmap (Grafik und Daten: CAIT/WRI)
- Graphic 2 by Johannes Friedrich based on work by Duncan Clark, Kiln, Mike Bostock and Jason Davies. Thanks also to Jamie Cotta | Data is for GHG emissions excluding land-use change and forestry and excluding bunker fuels. The EU is considered an emitter for this graph. For more information visit our WRI blog.
……………………………………………………………………………………………
1 Please note that this circle chart visualization excludes emissions and removals from land use, land-use change and forestry (LULUCF) and bunker fuels sectors. For the complete inventory with sectoral breakdown, please refer to CAIT Climate Data Explorer.
2 The emissions data are sourced from FAOSTAT – “Burning Savannah”. Available at: http://www.fao.org/faostat/en/#data/GH. According to its documentation [http://fenixservices.fao.org/faostat/static/documents/GH/GH_e.pdf], the yearly burned area is “produced from monthly statistics of the Global Fire Emission Database v.4, based on MODIS remote-sensing data.” It is hard to conclude solely from the data whether this reduction is caused by natural disturbance, or policy/action implemented. However, it is important to note Australia’s Carbon Farming Initiative Savannah burning methodology [http://www.environment.gov.au/climate-change/emissions-reduction-fund/cfi/methodologies/determinations/savanna-burning] which could potentially have contributed to this reduction [https://www.csiro.au/en/Research/LWF/Areas/Ecosystems-biodiversity/Managing-landscapes-for-biodiversity/Fire-ecology/Burning-emissions]
3 Ranking and the trend analysis are based on CAIT Country GHG Emissions data of total GHG emissions excluding Land-use Change and Forestry (LUCF) from 2003-2013.


