No Doubt About It: EVs Really Are Cleaner Than Gas Cars
As electric vehicles become a bigger part of the global car fleet, a contrarian take seems to surface every few months: are electric vehicles really that clean?
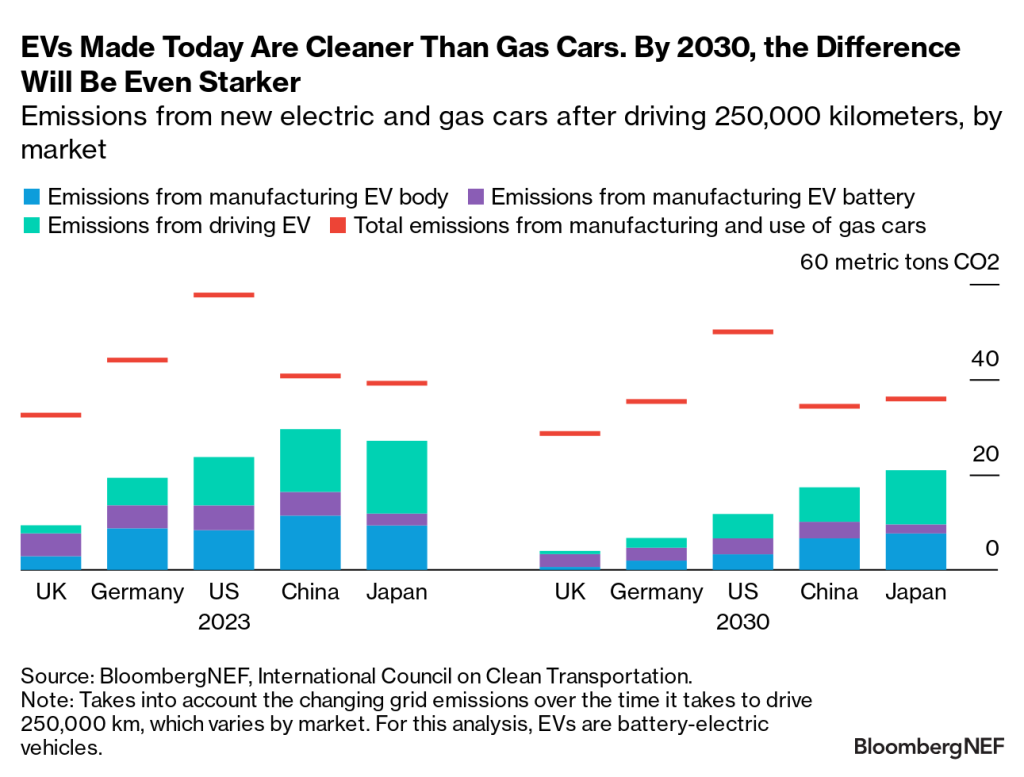
When it comes to lifecycle emissions, the answer is a resounding yes. According to a new report by BloombergNEF, in all analyzed cases, EVs have lower lifecycle emissions than gas cars. Just how much lower depends on how far they are driven, and the cleanliness of the grid where they charge.
EVs generate most CO2 emissions in the beginning
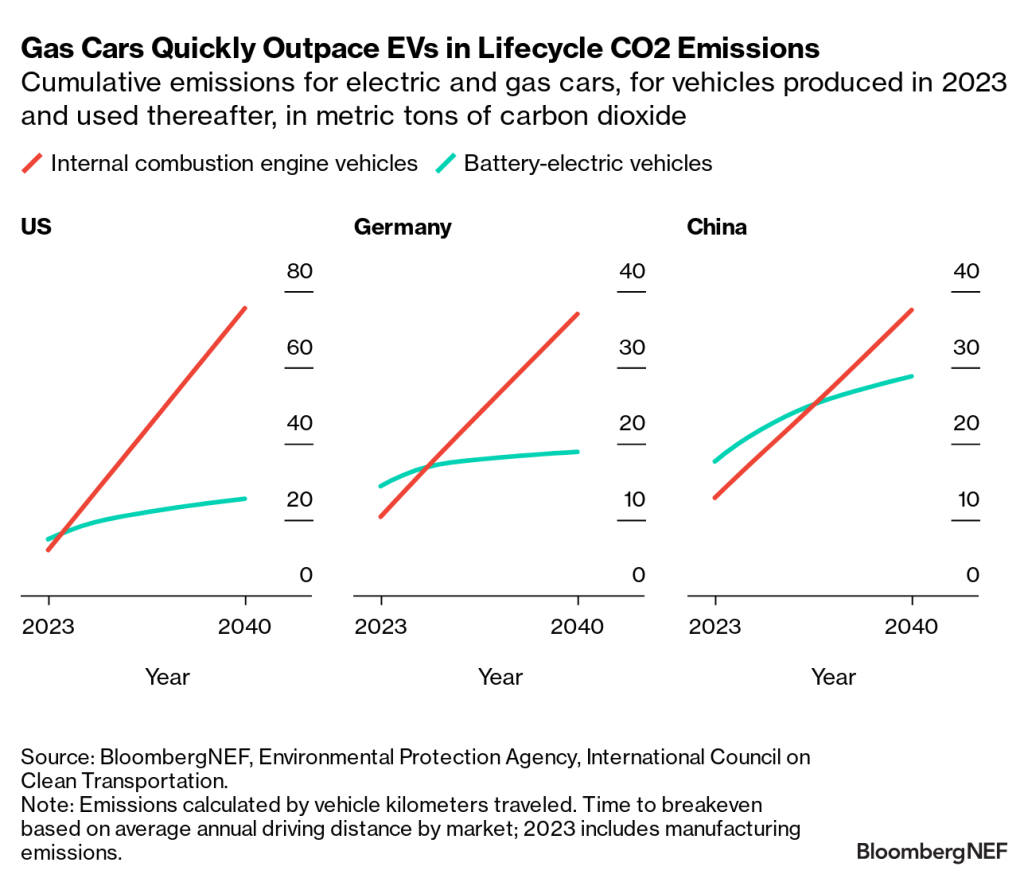
At the beginning of their lives, battery-electric vehicles, or BEVs, are emissions-intensive, thanks in large part to their battery-manufacturing needs. But once on the road, internal combustion engine vehicles (ICEs) quickly speed past BEVS – in terms of CO2 emissions, at least – because of the heavy emissions that gas-guzzling cars spew.
To determine the breakeven point, BloombergNEF looked at five different regions: the US, China, Germany, the UK and Japan. In any of these markets, the lifecycle CO2 emissions of a medium-sized BEV manufactured today and driven for 250,000 kilometers (155,000 miles) would be
27-71% lower than those of equivalent ICE vehicles.
A driver in the US would reach the breakeven point at 41,000 km – or in around two years of driving, assuming an average annual distance traveled of around 19,000 km. In China, meanwhile, the breakeven distance would fall at 118,000 km, or after roughly 10 years, due to the region’s fossil-fuel-heavy grid.
A cleaner grid creates a virtuous cycle of cleaner EVs
With zero-emission generation on the rise worldwide, that breakeven point could come a lot sooner by the end of the decade.
Across the five markets surveyed, the lifecycle breakeven falls to between one and four years for a BEV manufactured in 2030. A driver in the US will only need to travel about 21,000 kilometers, or around a year’s worth of driving, for a BEV to be cleaner than an ICE. A driver in China would still need longer than drivers in other areas surveyed, but it would take them only 53,000 km – or slightly over four years – to reach the breakeven point.
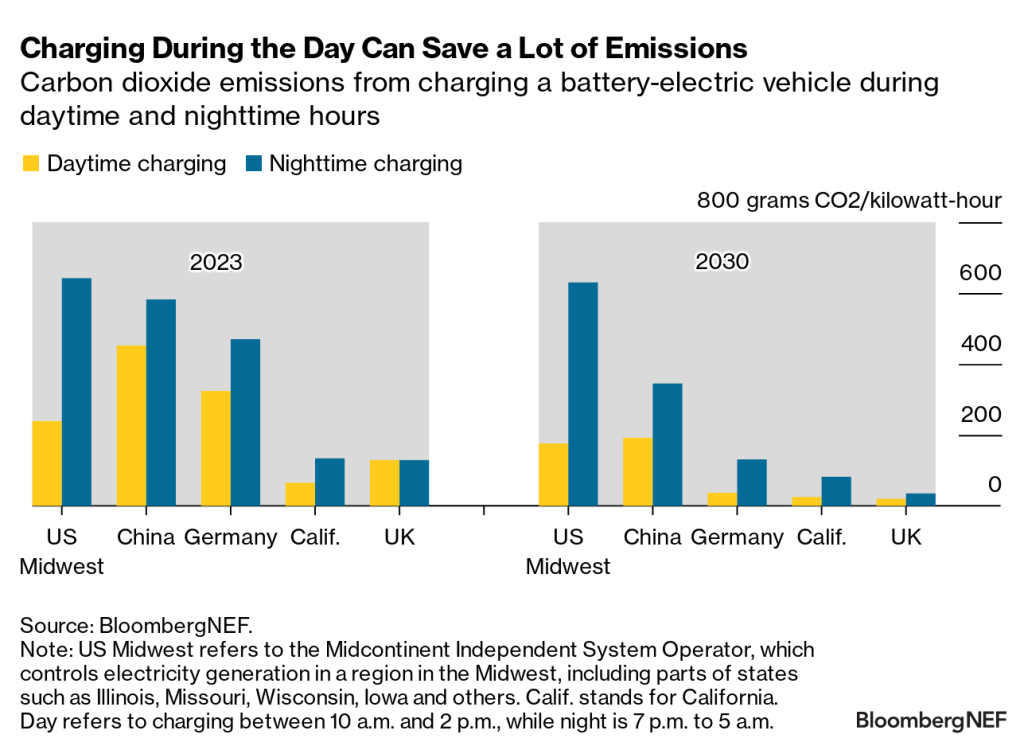
BNEF’s analysis assumes an average emissions intensity for each region per year. But in reality, EV charging emissions intensity will vary depending on the regional energy mix – and even the time of day charging takes place.
For instance, an EV driver in California who charges during daytime hours will be produce half as many grams of CO2 per kilowatt-hour charged as a driver who charges at night. The gap between daytime and nighttime charging grows even wider by the end of the decade.
Utilities currently offer tariffs to encourage overnight charging, but in the future they may get a better “green bang for their buck” by incentivizing charging at peak renewable hours.
Improvements to the EV manufacturing process could make electric vehicles even greener. Recycling batteries could help reduce the lifecycle emissions of new EVs, while on-shoring or near-shoring the full battery manufacturing process – which laws like the US’s Inflation Reduction Act have encouraged – could reduce emissions associated with global transport.
- BNEF clients can access the full report here.
- (Second chart corrected to display correct ICE and BEV data for Germany and China. Title of third chart updated to specify daytime charging can save emissions.)
Source
By Corey Cantor, Senior Associate, Electric Vehicles, BloombergNEF 2024


