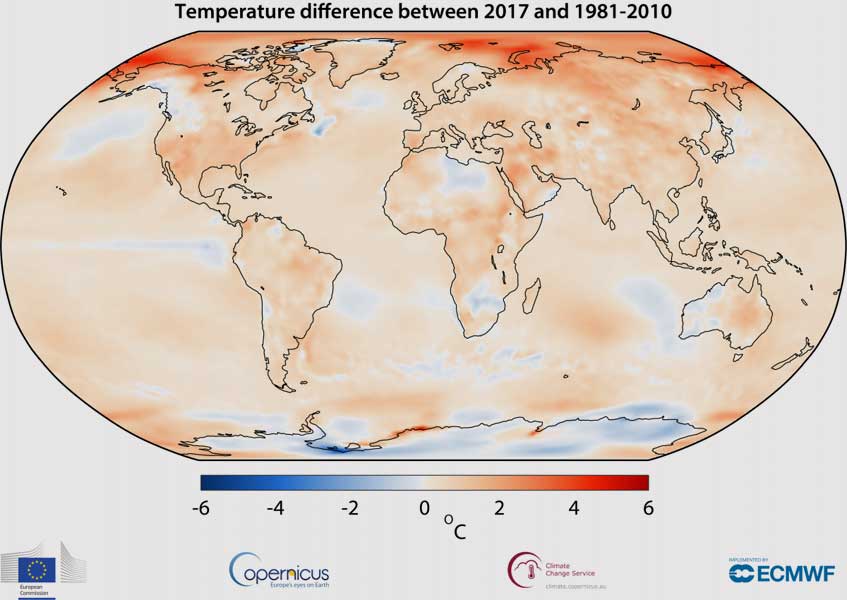
2017 extends period of exceptionally warm years, first complete datasets show
The first complete temperature datasets for 2017 show that last year was the third in a row of exceptionally warm years, the Copernicus Climate Change Service (C3S) implemented by the European Weather Centre (ECMWF) can announce.
One dataset, produced by ECMWF, shows that the global average surface air temperature exceeded 14.7°C, making 2017:
- about 0.1°C cooler than the warmest year on record, 2016, and warmer than the previous second warmest year, 2015
- the warmest year on record not influenced by warming El Niño conditions in the tropical Pacific
- around 0.5°C warmer than the 1981–2010 climatological reference period
- an estimated 1.2°C warmer than the pre-industrial value for the 18th century.
Comparable results have been obtained by C3S from a reanalysis dataset produced by the Japan Meteorological Agency (JMA).
The method used to produce the datasets is to combine millions of meteorological and marine observations, including from satellites, with models to produce a complete reanalysis of the atmosphere. The combination of observations with models makes it possible to estimate temperatures at any time and in any place across the globe, even in data-sparse areas such as the polar regions.
The results support the provisional announcement by the World Meteorological Organization (WMO) two months ago that 2017 was set to be among the three warmest years on record. Other datasets used in the WMO announcement, which are derived from monthly climatological data for a smaller number of long-term observing sites, are also expected to concur when they are released shortly. All datasets will contribute to the consolidated statement to be issued by WMO on 2017 temperatures.
Temperatures for 2017 were higher than the 1981–2010 climatological average over most regions of the world. They were most above average over parts of the Arctic. 2017 was close to the warmest year on record despite cooling La Niña conditions both early and late in the year over the equatorial eastern Pacific Ocean. The warmest months of 2016 occurred in the declining phase of a strong El Niño, which also influenced temperatures in 2015, making 2017 the warmest year on record that was not influenced by an El Niño.
2017 in Europe – hot in the north, dry in the south
C3S provides continuous monitoring for Europe, which was generally warmer than the long-term average, particularly in the far north. Longyearbyen on the Norwegian island of Spitsbergen, one of the northernmost towns in the world, repeatedly experienced monthly mean temperatures more than 6°C above the 1981–2010 average. Sea-ice cover was also below average, especially during the cooler months at the beginning and the end of the year. Meanwhile, southern Europe was hit hard by prolonged dry conditions from late spring into the autumn months. The dry conditions led to water shortages in many areas and facilitated the spread of wildfires on the Iberian Peninsula.
Taking stock for Paris
Under the Paris Agreement reached in 2015, countries will take stock at five-year intervals of their progress in limiting greenhouse gas emissions to curb the rise in global temperatures. The Copernicus Climate Change Service, as well as other agencies, support the stocktaking by providing continuous monitoring of key climate variables.
The differences between temperature datasets mainly stem from differences in their coverage of the polar regions and from differences in their estimates of sea-surface temperature. Five-year averaging reduces differences among temperature datasets, showing that since the mid-1970s the global surface air temperature has on average increased by 0.1°C every five to six years, although the rate of warming, viewed from a five-year perspective, has not been steady. The combined analysis of these datasets provides a clear picture of the latest five-year average global temperature as the highest on record, and it shows a warming of around 1.1°C since the start of the industrial era.
- For more information on the Copernicus Climate Change Service, visit https://climate.copernicus.eu/.
- For more information on the Copernicus Atmosphere Monitoring Service, visit http://atmosphere.copernicus.eu/.
- For more information on ECMWF, visit https://www.ecmwf.int/.


