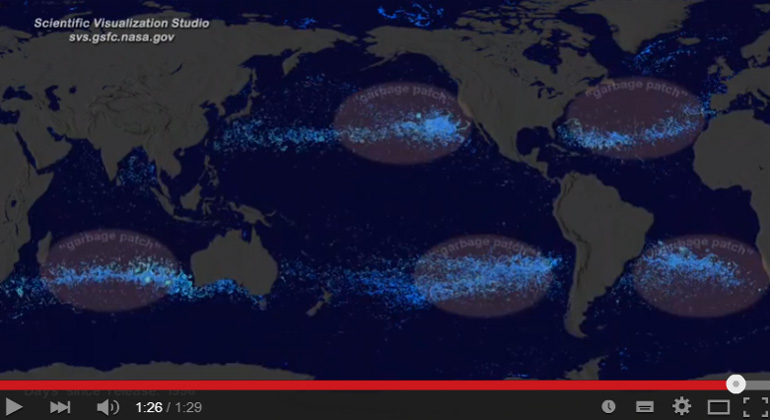
NASA’s Ocean Garbage Islands Simulation
NASA’s Scientific Visualization Studio created a computer simulation to show how five major ‘garbage islands’ are accumulated in the oceans around the world. Plastics that find their way from your street drains into the sea collect along a pattern that has created the nasty and dangerous patches of man-made trash.
Garbage Patch Visualization Experiment
We wanted to see if we could visualize the so-called ocean garbage patches. We start with data from floating, scientific buoys that NOAA has been distributing in the oceans for the last 35-year represented here as white dots. Let’s speed up time to see where the buoys go… Since new buoys are continually released, it’s hard to tell where older buoys move to. Let’s clear the map and add the starting locations of all the buoys… Interesting patterns appear all over the place. Lines of buoys are due to ships and planes that released buoys periodically. If we let all of the buoys go at the same time, we can observe buoy migration patterns. The number of buoys decreases because some buoys don’t last as long as others. The buoys migrate to 5 known gyres also called ocean garbage patches.
We can also see this in a computational model of ocean currents called ECCO-2. We release particles evenly around the world and let the modeled currents carry the particles. The particles from the model also migrate to the garbage patches. Even though the retimed buoys and modeled particles did not react to currents at the same times, the fact that the data tend to accumulate in the same regions show how robust the result is – more