Natural Disasters since 1900: Over 8 Million Deaths and 7 Trillion US Dollars damage
The CATDAT database contains socioeconomic loss and metrics from natural disasters globally: Floods have caused the highest damage, earthquakes and storms show an increasing role in recent times – Studies help catastrophe management.
More than seven trillion US dollars economic damage and eight million deaths via natural disasters since the start of the 20th century: These figures have been calculated and collected by the risk engineer Dr. James Daniell from Karlsruhe Institute of Technology (KIT). His database CATDAT looks at examining socioeconomic indicators as well as collecting and evaluating socioeconomic loss data through time, and has built a massive base for his post-disaster risk model which helps governments and aid organisations with catastrophe management and assessing rapidly the scale of a disaster. James will present his results today at the 2016 European Geosciences Union General Assembly in Vienna.
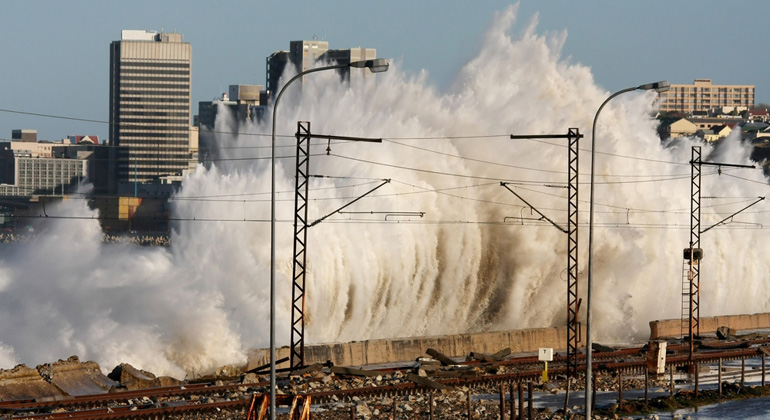
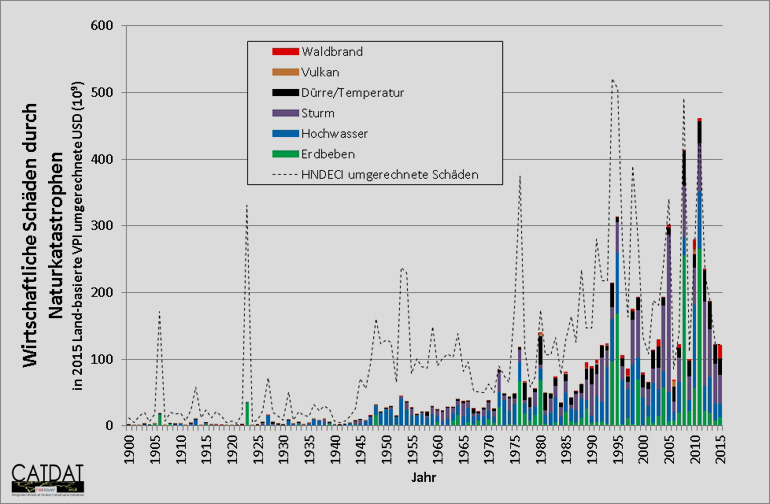
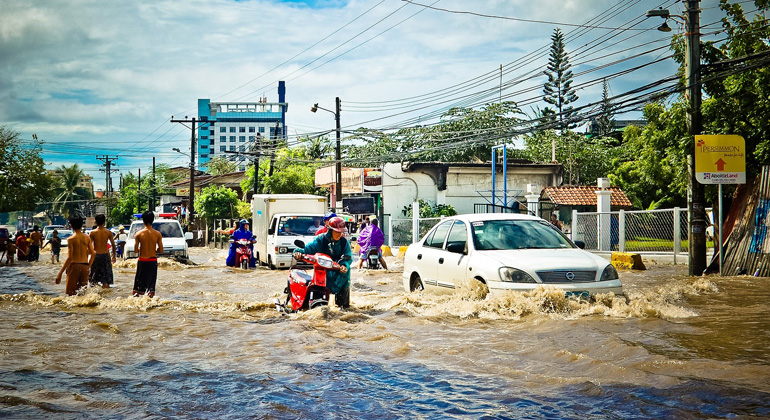
As part of CATDAT, James Daniell has collected and evaluated over 35,000 natural disaster events since 1900 globally. Around a third of economic losses between 1900 and 2015 have been caused via floods. Earthquakes have caused around 26 percent of losses, Storms around 19 percent, Volcanic eruptions around 1 percent. „Over the last 100+ years the economic losses via natural disasters, in absolute terms, have increased“, said Dr. Daniell, who conducts research at KIT as a John Monash Scholar is at the Geophysical Institute as well as the Center for Disaster Management and Risk Reduction Technology CEDIM. Over the whole time period, floods have caused the highest amount of economic losses, however, in recent times, since 1960, the highest percentage has switched to storm (and storm surge) with around 30% of losses.
In relation to the current capital value of infrastructure and buildings in each country, the damage is reducing from natural catastrophes. “Less developed nations are often more vulnerable towards catastrophes – that means relative to population and capital – more deaths and higher economic losses are expected post-event”, says the Civil/Structural engineer and Geophysicist. One common reason is the building quality itself in that building regulations and disaster codes even if present, are often not adhered to. In addition, the locations where people work (like in Bangladesh on the coasts), are economic centers and highly populated due to this, and the financial gains or livelihoods, often outweigh the potential disaster risks.
For his analyses, he has created and collected many socioeconomic indices for the world, countries and often even provinces like human development, GDP, capital stock, exchange rates, price indices and data on security, building inventory and vulnerability in all countries exposed to disasters. In order to examine the trend of vulnerability over time, he normalised the losses to the year 2015 by examining the effect of historic events for today’s conditions. “Here there is a clear trend, that many (but not all) countries are protecting themselves better against disasters by building better, and therefore and are reducing their risk of high losses”, says Dr. Daniell. The improvements in flood protection are the most prominent when looking at the trends, as through the 1900-1960 time period, many huge events occurred, but from 1960 onwards, the normalised losses steadily reduce. The most visible reduction is seen in China and Japan.
Depending on the metric used to convert event-year dollars to current 2015 dollars (i.e. consumer price index, building cost index or otherwise), the natural disaster damage bill is between 6.5 and 14 trillion USD. The 7 trillion USD bill from Dr. Daniell is based on a country-by-country GDP-deflator based price index, however the components of loss from natural disasters often differ significantly in addition to the loss estimate itself. “It is often impossible to get one exact value for a disaster event, as economic losses are often difficult to quantify, and death tolls are often overestimated (for example, the Haiti earthquake in 2010), or underestimated (like Uzbekistan in 1966)“, he says, and therefore provides a lower and upper bound to his estimates of each past events from literature.
Looking at the largest economic losses, the year 2011 with major earthquakes in Japan and New Zealand is the highest loss to date: “with around 335 billion USD direct damage, the Tohoku earthquake-tsunami-nuclear sequence on 11 March 2011 is the highest single-event natural catastrophe loss”, says James Daniell. From the earthquake and following tsunami, around 18500 people died and around 450000 became homeless.
Deaths by natural disasters
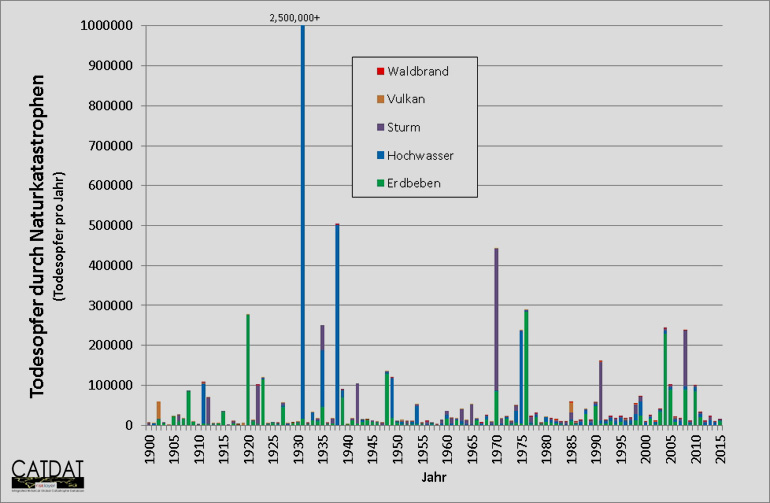
Over 8 million deaths are shown in the CATDAT database since 1900 for earthquake, flood, storm, volcano and bushfires (withough counting deaths due to long term effects or drought/famine).
The amount of deaths due to earthquake between 1900 and 2015 from the database at around 2.32 million (with a range of 2.18-2.63 million). Around 59 percent of them died as a result of the collapse of masonry buildings, and 28% of them due to secondary effects such as tsunami or landslides. Volcanic eruptions in the same time period have killed only 98,000 people (range: 83,000-107,000). However, volcanic eruptions before 1900, like the Tambora 1815 event, have the possibility to cause massive death tolls and also cause lower temperatures around the world leading to food security issues. “The absolute total of deaths through natural catastrophes has remained reasonably constant with a slight decrease. Around 50,000 people on average die each year. However, relative to population, death tolls have decreased significantly from 1900-2015“, explains Dr. Daniell. “Over the entire time period, half of people died due to flood. However, with better planning, warnings and preventive measures, the death rate due to floods is signifcantly decreasing. Since 1960, earthquakes have caused the highest death percentage with around 40% of disaster deaths. Compared to the global death rate due to all causes, the rate of deaths due to natural disasters has remained quite constant.
With each event over 100000 deaths, the 2004 Indian Ocean tsunami (around 230,000) and 2008 Cyclone Nargis (around 140000) in Myanmar are the largest disasters since 2000 in terms of deaths. The event with the highest death toll to date is the Great Floods of 1931 in China with a mean estimate around 2.5 million deaths.
The CATDAT Database
Since 2003, James Daniell has built the CATDAT Database from information out of Online Archives, books, reports from institutions, publications and other databases around the world, with original sources in over 90 languages. In his PhD dissertation, he developed a global rapid loss estimation model for earthquake, using empirical data from over 8000 earthquakes since 1900 and the associated socioeconomic climate over time. Using this basis, he has calculated a death toll estimate and economic loss estimate for each event since late 2009. At the start of 2016, Dr.-Ing. Daniell received one of three KIT Doctoral Awards from KIT awarded to dissertations finished in 2014. The model works very well for other disaster types, and he has continually updated his model with other natural catastrophes with over 35000 events collected since 1900, and many additional events pre-1900.
James Daniell is a John Monash Scholar. This title is given to outstanding young Australian researchers. James was among eight Australians in 2009 to win Australia’s most prestigious postgraduate scholarship and continues his research and work in conjunction with the Foundation. More information: www.johnmonash.com
European Geosciences Union – 2016 General Assembly in Vienna
James Daniell will present the results of his research today at the annual European Geosciences Union in Vienna. At the assembly he is also the co-convener of 2 sessions on the theme of Natural Hazards in conjunction with CEDIM. More information: http://www.egu2016.eu/


